Developing Your First R Package
Daniel Anderson
Week 10


Background
Effect sizes
Standardized mean differences
Assumes reasonably normally distributed distributions (mean is a good indicator of central tendency)
Differences in means may not reflect differences at all points in scale if variances are different
Substantive interest may also lie with differences at other points in the distribution.
Varying differences
Quick simulated example
library(tidyverse)common_var <- tibble(low = rnorm(1000, 10, 1), high = rnorm(1000, 12, 1), var = "common")diff_var <- tibble(low = rnorm(1000, 10, 1), high = rnorm(1000, 12, 2), var = "diff")d <- bind_rows(common_var, diff_var)head(d)## # A tibble: 6 x 3## low high var ## <dbl> <dbl> <chr> ## 1 7.855059 10.69834 common## 2 10.40831 11.51090 common## 3 9.980279 10.84525 common## 4 10.76777 13.45303 common## 5 9.934628 11.16377 common## 6 9.520182 10.47681 commonRestructure for plotting
d <- d %>% pivot_longer( -var, names_to = "group", values_to = "value" ) d## # A tibble: 4,000 x 3## var group value## <chr> <chr> <dbl>## 1 common low 7.855059## 2 common high 10.69834 ## 3 common low 10.40831 ## 4 common high 11.51090 ## 5 common low 9.980279## 6 common high 10.84525 ## 7 common low 10.76777 ## 8 common high 13.45303 ## 9 common low 9.934628## 10 common high 11.16377 ## # … with 3,990 more rows
library(esvis)binned_es(common, value ~ group)## # A tibble: 6 x 11## q qtile_lb qtile_ub group_ref group_foc mean_diff length length1## <dbl> <dbl> <dbl> <chr> <chr> <dbl> <int> <int>## 1 1 0 0.3333333 high low -2.035098 1000 1000## 2 2 0.3333333 0.6666667 high low -1.930967 1000 1000## 3 3 0.6666667 1 high low -1.957844 1000 1000## 4 1 0 0.3333333 low high 2.035098 1000 1000## 5 2 0.3333333 0.6666667 low high 1.930967 1000 1000## 6 3 0.6666667 1 low high 1.957844 1000 1000## # … with 3 more variables: psd <dbl>, es <dbl>, es_se <dbl>binned_es(diff, value ~ group)## # A tibble: 6 x 11## q qtile_lb qtile_ub group_ref group_foc mean_diff length length1## <dbl> <dbl> <dbl> <chr> <chr> <dbl> <int> <int>## 1 1 0 0.3333333 high low -0.9691199 1000 1000## 2 2 0.3333333 0.6666667 high low -1.922010 1000 1000## 3 3 0.6666667 1 high low -2.981083 1000 1000## 4 1 0 0.3333333 low high 0.9691199 1000 1000## 5 2 0.3333333 0.6666667 low high 1.922010 1000 1000## 6 3 0.6666667 1 low high 2.981083 1000 1000## # … with 3 more variables: psd <dbl>, es <dbl>, es_se <dbl>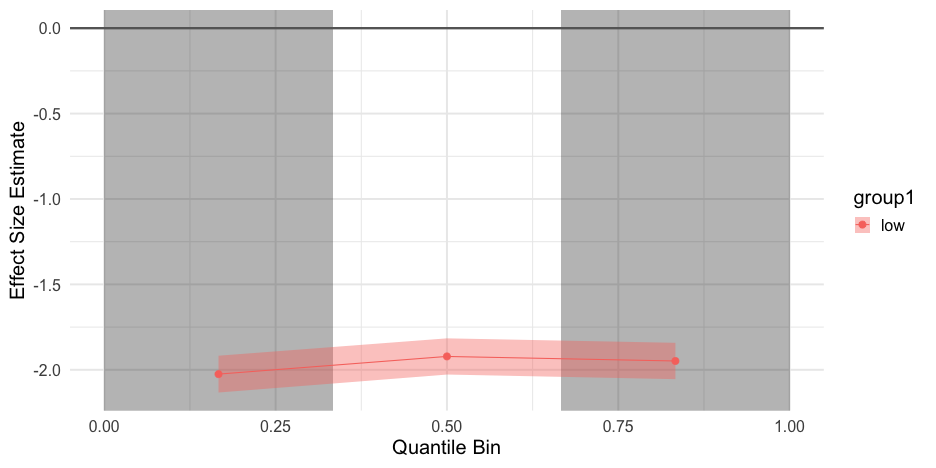


Package Creation
The (or rather a) recipe
- Come up with
a brilliantan idea- can be boring and mundane but just something you do a lot
- Write a function! or more likely, a set of functions
- Create package skelton
- Document your function
- Install/fiddle/install
- Write tests for your functions
- Host your package somewhere public (GitHub is probably best) and promote it - leverage the power of open source!
Use tools to automate
A really good point
1a) check that no one had the same idea 😇
— Maëlle Salmon 🐟 (@ma_salmon) April 10, 2018
And some further recommendations/good advice
The approach I took...
describe <- function(data, column_name) { x <- data[[column_name]] nval <- length(na.omit(x)) nmiss <- sum(is.na(x)) mn <- mean(x, na.rm = TRUE) stdev <- sd(x, na.rm = TRUE) out <- tibble::tibble(N = nval + nmiss, n_valid = nval, n_missing = nmiss, mean = mn, sd = stdev) out}The approach I took...
describe <- function(data, column_name) { x <- data[[column_name]] # Extract just the vector to summarize nval <- length(na.omit(x)) nmiss <- sum(is.na(x)) mn <- mean(x, na.rm = TRUE) stdev <- sd(x, na.rm = TRUE) out <- tibble::tibble(N = nval + nmiss, n_valid = nval, n_missing = nmiss, mean = mn, sd = stdev) out}The approach I took...
describe <- function(data, column_name) { x <- data[[column_name]] nval <- length(na.omit(x)) # Count non-missing nmiss <- sum(is.na(x)) # Count missing mn <- mean(x, na.rm = TRUE) # Compute mean stdev <- sd(x, na.rm = TRUE) # Computer SD out <- tibble::tibble(N = nval + nmiss, n_valid = nval, n_missing = nmiss, mean = mn, sd = stdev) out}The approach I took...
describe <- function(data, column_name) { x <- data[[column_name]] nval <- length(na.omit(x)) nmiss <- sum(is.na(x)) mn <- mean(x, na.rm = TRUE) stdev <- sd(x, na.rm = TRUE) # Compile into a df out <- tibble::tibble(N = nval + nmiss, n_valid = nval, n_missing = nmiss, mean = mn, sd = stdev) out}The approach I took...
describe <- function(data, column_name) { x <- data[[column_name]] nval <- length(na.omit(x)) nmiss <- sum(is.na(x)) mn <- mean(x, na.rm = TRUE) stdev <- sd(x, na.rm = TRUE) out <- tibble::tibble(N = nval + nmiss, n_valid = nval, n_missing = nmiss, mean = mn, sd = stdev) out # Return the table}Informal testing
set.seed(8675309)df1 <- tibble(x = rnorm(100))df2 <- tibble(var_miss = c(rnorm(1000, 10, 4), rep(NA, 27)))describe(df1, "x")## # A tibble: 1 x 5## N n_valid n_missing mean sd## <int> <int> <int> <dbl> <dbl>## 1 100 100 0 0.05230278 0.9291437describe(df2, "var_miss")## # A tibble: 1 x 5## N n_valid n_missing mean sd## <int> <int> <int> <dbl> <dbl>## 1 1027 1000 27 9.881107 4.090208roxygen2 comments
Typical arguments
@param: Describe the formal arguments. State argument name and the describe it.
#' @param x Vector to describe
@return: What does the function return
#' @return A tibble with descriptive data
@exampleor more commonly@examples: Provide examples of the use of your function.
DESCRIPTION
Metadata about the package. Default fields for our package are
Package: practiceVersion: 0.0.0.9000Title: What the Package Does (One Line, Title Case)Description: What the package does (one paragraph).Authors@R: person("First", "Last", email = "first.last@example.com", role = c("aut", "cre"))License: What license is it under?Encoding: UTF-8LazyData: trueByteCompile: trueRoxygenNote: 6.0.1DESCRIPTION
Metadata about the package. Default fields for our package are
Package: practiceVersion: 0.0.0.9000Title: What the Package Does (One Line, Title Case)Description: What the package does (one paragraph).Authors@R: person("First", "Last", email = "first.last@example.com", role = c("aut", "cre"))License: What license is it under?Encoding: UTF-8LazyData: trueByteCompile: trueRoxygenNote: 6.0.1This is where the information for citation(package = "practice") will come from.
DESCRIPTION
Metadata about the package. Default fields for our package are
Package: practiceVersion: 0.0.0.9000Title: What the Package Does (One Line, Title Case)Description: What the package does (one paragraph).Authors@R: person("First", "Last", email = "first.last@example.com", role = c("aut", "cre"))License: What license is it under?Encoding: UTF-8LazyData: trueByteCompile: trueRoxygenNote: 6.0.1This is where the information for citation(package = "practice") will come from.
Some advice - edit within RStudio, or a good text editor like sublimetext or VSCode. "Fancy" quotes and things can screw this up.
Description File Fields
The ‘Package’, ‘Version’, ‘License’, ‘Description’, ‘Title’, ‘Author’, and ‘Maintainer’ fields are mandatory, all other fields are optional. - Writing R Extensions
Some optional fields include
- Imports and Suggests (we'll do this in a minute).
- URL
- BugReports
- License (we'll have {usethis} create this for us).
- LazyData
DESCRIPTION for {esvis}
Package: esvisType: PackageTitle: Visualization and Estimation of Effect SizesVersion: 0.3.1Authors@R: person("Daniel", "Anderson", email = "daniela@uoregon.edu", role = c("aut", "cre"))Description: A variety of methods are provided to estimate and visualize distributional differences in terms of effect sizes. Particular emphasis is upon evaluating differences between two or more distributions across the entire scale, rather than at a single point (e.g., differences in means). For example, Probability-Probability (PP) plots display the difference between two or more distributions, matched by their empirical CDFs (see Ho and Reardon, 2012; <doi:10.3102/1076998611411918>), allowing for examinations of where on the scale distributional differences are largest or smallest. The area under the PP curve (AUC) is an effect-size metric, corresponding to the probability that a randomly selected observation from the x-axis distribution will have a higher value than a randomly selected observation from the y-axis distribution. Binned effect size plots are also available, in which the distributions are split into bins (set by the user) and separate effect sizes (Cohen's d) are produced for each bin - again providing a means to evaluate the consistency (or lack thereof) of the difference between two or more distributions at different points on the scale. Evaluation of empirical CDFs is also provided, with built-in arguments for providing annotations to help evaluate distributional differences at specific points (e.g., semi-transparent shading). All function take a consistent argument structure. Calculation of specific effect sizes is also possible. The following effect sizes are estimable: (a) Cohen's d, (b) Hedges' g, (c) percentage above a cut, (d) transformed (normalized) percentage above a cut, (e) area under the PP curve, and (f) the V statistic (see Ho, 2009; <doi:10.3102/1076998609332755>), which essentially transforms the area under the curve to standard deviation units. By default, effect sizes are calculated for all possible pairwise comparisons, but a reference group (distribution) can be specified.DESCRIPTION for {esvis} (continued)
Depends: R (>= 3.1)Imports: sfsmisc, ggplot2, magrittr, dplyr, rlang, tidyr (>= 1.0.0), purrr, Hmisc, tibbleURL: https://github.com/datalorax/esvisBugReports: https://github.com/datalorax/esvis/issuesLicense: MIT + file LICENSELazyData: trueRoxygenNote: 7.0.2Suggests: testthat, viridisLiteDeclare dependencies
The function depends on the
tibblefunction within the {tibble} package.We have to declare this dependency
My preferred approach
Declare package dependencies:
usethis::use_package()Create a package documentation page:
usethis::use_package_doc()Declare all dependencies for your package there
Only import the functions you need - not the entire package
- Use
#' importFrom pkg fun_name
- Use
Generally won't have to worry about namespacing. The likelihood of conflicts is also reduced, so long as you don't import the full package.
Testing
We'll skip over testing for today, because we just don't have time to cover everything. A few good resources:

Check your R package
Use
devtools::check()to run the same checks CRAN will run on your R package.Use
devtools::check_rhub()to test your package on https://builder.r-hub.io/ (several platforms and R versions)Use
devtools::build_win()to run the checks on CRAN computers.
Check your R package
Use
devtools::check()to run the same checks CRAN will run on your R package.Use
devtools::check_rhub()to test your package on https://builder.r-hub.io/ (several platforms and R versions)Use
devtools::build_win()to run the checks on CRAN computers.
I would not run the latter two until you're getting close to being ready to submit to CRAN.


A few other best practices
Create a
READMEwithusethis::use_readme_rmd.Try to get your code coverage up above 80%.
A few other best practices
Create a
READMEwithusethis::use_readme_rmd.Try to get your code coverage up above 80%.
Automate wherever possible ({devtools} and {usethis} help a lot with this)
A few other best practices
Create a
READMEwithusethis::use_readme_rmd.Try to get your code coverage up above 80%.
Automate wherever possible ({devtools} and {usethis} help a lot with this)
Use the {goodpractice} package to help you package code be more robust, specifically with
goodpractice::gp(). It will give you lots of good ideas
A few other best practices
Host on GitHub, and capitalize on integration with other systems (all free, but require registering for an account)


codecov
You can test your code coverage each time you push a new commit by using codecov. Initialize with usethis::use_coverage(). Overall setup process is pretty similar to Travis CI/Appveyor.
Easily see what is/is not covered by tests!
