Shiny: Part 2
Daniel Anderson
Week 8, Class 2
UI
The
uidefines the look and feel of the app - the user interfaceUse it to define where output "lives"
It also defines the inputs for the
server, where functions are actually evaluated.In the template/default case, a
sliderInputhas been defined, which we're calling"bins". It will take on values from 1 to 50, and will start at 30.Access the specific value the user selects within the
server, throughinput$bins.
Table creation
Because this is base syntax, I'll give you the basics for the table, you focus on the shiny part
input_bins <- 30 # placeholder for whatever the input isx <- faithful[, 2] # data you're working withbins <- seq(min(x), max(x), length.out = input_bins + 1)h <- hist(x, breaks = bins, plot = FALSE)tibble(lower = lag(h$breaks), upper = h$breaks) %>% drop_na(lower) %>% mutate(counts = h$counts) %>% mutate_if(is.numeric, round, 2)Different pages
Add a navbar
Instead of using a tabset with
tabsetPanel, you might want to have a navbar at the top of the page, which you can create withnavbarPage.Can be a bit more complicated - each
tabsetneeds to include everything, including thesidebarPanel(if present), could include tabsets,mainPanel, etc.
Different pages
Add a navbar
Instead of using a tabset with
tabsetPanel, you might want to have a navbar at the top of the page, which you can create withnavbarPage.Can be a bit more complicated - each
tabsetneeds to include everything, including thesidebarPanel(if present), could include tabsets,mainPanel, etc.Essentially each tab from the
navbarbecomes an entirely new page.
More on the navbar
Can really help with organization/flexibility (you could even have tabs within a page)
Refactoring can help organization A LOT
- Pull pieces out to try to make code more readable/less buggy.
- You might consider shiny modules
First dashboard - ui
library(shiny)library(shinydashboard)ui <- dashboardPage( dashboardHeader(title = "Basic dashboard"), dashboardSidebar(), dashboardBody( # Boxes need to be put in a row (or column) fluidRow( box(plotOutput("plot1", height = 250)), box( title = "Controls", sliderInput("slider", "Number of observations:", 1, 100, 50) ) ) ))Sidebar
Probably the defining characteristic of the dashboard
- Define a
sidebarMenuwithmenuItems
- Define a
Example
sidebarMenu( menuItem("Histogram", tabName = "histo", icon = icon("chart-bar")), menuItem("Bin Counts", tabName = "bins", icon = icon("table")))You can also do things like put the slider in the sidebarMenu
[demo]
Extension
There's lots of extensions for shiny, and quite a few (but not as many) for shinydashboard
Consider themeing shiny apps with {shinythemes} and dashboards with {dashboardthemes}
Consider themeing figures to match your shiny theme with {thematic}
Inputs
inputis a basically a list object that contains objects from the ui
ui <- fluidPage( numericInput("count", label = "Number of values", value = 100))After writing this code, input$count will be a available in the server, and the value it takes will depend on the browser input (starting at 100)
These are read-only, and cannot be modified
Selective read permissions
It must be in a reactive context, or it won't work.
That's why this results in an error
server <- function(input, output, session) { print(paste0("The value of input$count is ", input$count))}shinyApp(ui, server)# > Error in .getReactiveEnvironment()$currentContext() : # > Operation not allowed without an active reactive context. # > (You tried to do something that can only be done from inside a reactive expression or observer.)Simple example
From Mastering Shiny
Try this app. Type the letters in one at a time. Notice how it updates.
ui <- fluidPage( textInput("name", "What's your name?"), textOutput("greeting"))server <- function(input, output, session) { output$greeting <- renderText({ paste0("Hello ", input$name, "!") })}Programming style
Notice you don't have to "run" the code each time the input updates
Your app provides instructions to R. Shiny decides when it actually runs the code.
This is known as declarative programming
Normal R code is imperative programming - you decide when it's run. Declarative programming means you provide instructions, but don't actually run it.
Programming style
Notice you don't have to "run" the code each time the input updates
Your app provides instructions to R. Shiny decides when it actually runs the code.
This is known as declarative programming
Normal R code is imperative programming - you decide when it's run. Declarative programming means you provide instructions, but don't actually run it.
you describe your overall goals, and the software figures out how to achieve them
(from Hadley)
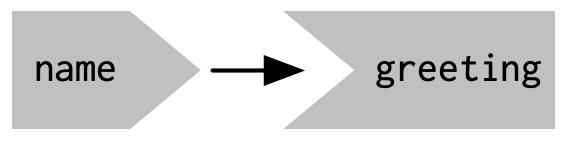
Reactive graph
image from Mastering Shiny
Normally, you understand R code by running it top to bottom
This doesn't work with shiny
Instead, we think through reactive graphs
Basic example
library(shiny)library(reactlog)reactlog_enable()ui <- fluidPage( textInput("name", "What's your name?"), textOutput("greeting"))server <- function(input, output, session) { output$greeting <- renderText({ paste0("Hello ", input$name, "!") })}shinyApp(ui, server)# close app, thenreactlogShow()Conclusions
Shiny is super customizable - almost limitless (see more examples here)
Great for building interactive plots, but you can use it for all sorts of other things too (including text and tables)
Really helpful and fun way to build data tools for practitioners
Takes some practice, but basically allows you to write normal R code, and get interactive websites